
AMAZON PUBLISHING
Growing subscriptions by turning data into stories


Overview
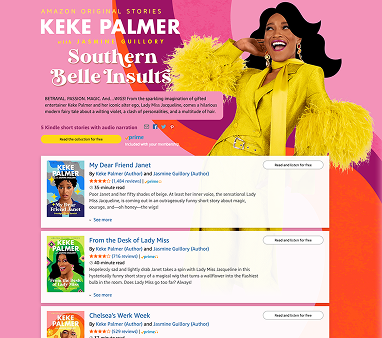
Amazon Publishing asked for a year-end promo site showcasing top books by category–to boost amazon Charts awareness and subscriptions and lift Kindle holiday sales. I led the creative direction and produced illustrations to bring the concept to life.
Role
Creative direction, illustrator
responsibilities
UX and visual design
collaborators
Editorial directors, UX team, engineers
impact
126,652 new subscribers to Amazon Charts; 1 million page views; 3.36% conversion rate
The project
Customer problems
As a customer, I want to know what books were popular this year so that I’m in-the know and can find my next read.
Business problem
As a business, I want to grow awareness and subscriptions for Amazon Charts (a NYT Bestsellers competitor) and drive Kindle sales during the holiday season.
Success metrics
Increase subscriptions for Amazon Charts newsletter to 100,000.
Approach
Define the experience
Browse, discover, wonder: Let me browse the experience at my own speed, and choose which parts to dig into
Simple: Whether on my laptop or phone, I love to scroll fun, visual, editorial content. When I do engage, let me get the goods in one hover or click.
Share-ability: I share because it shows off my book prowess, because a fact was out-of-this-world interesting, or because it's one of the coolest things our industry has put out.
Novel, fresh facts: I find the content compelling because the facts and data tell a story that I hadn't heard before.

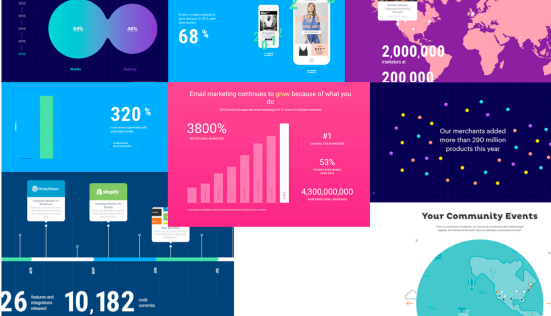
Gather inspiration
We gathered inspiration from other sites that told stories with data. We also took an audit from other projects at Amazon to ensure that this site fit into our ecosystem.
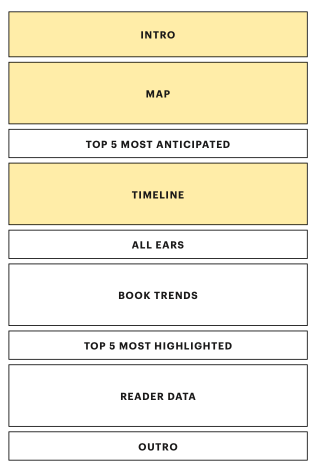
Define the high-level structure
Looking at the data we had, I sketched the high-level structure of page.
Visualizing the Data
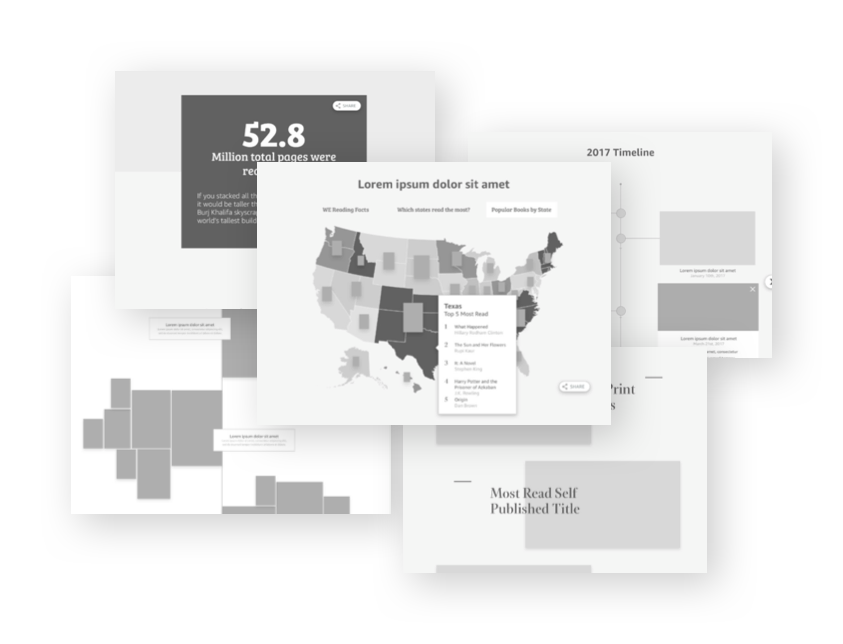
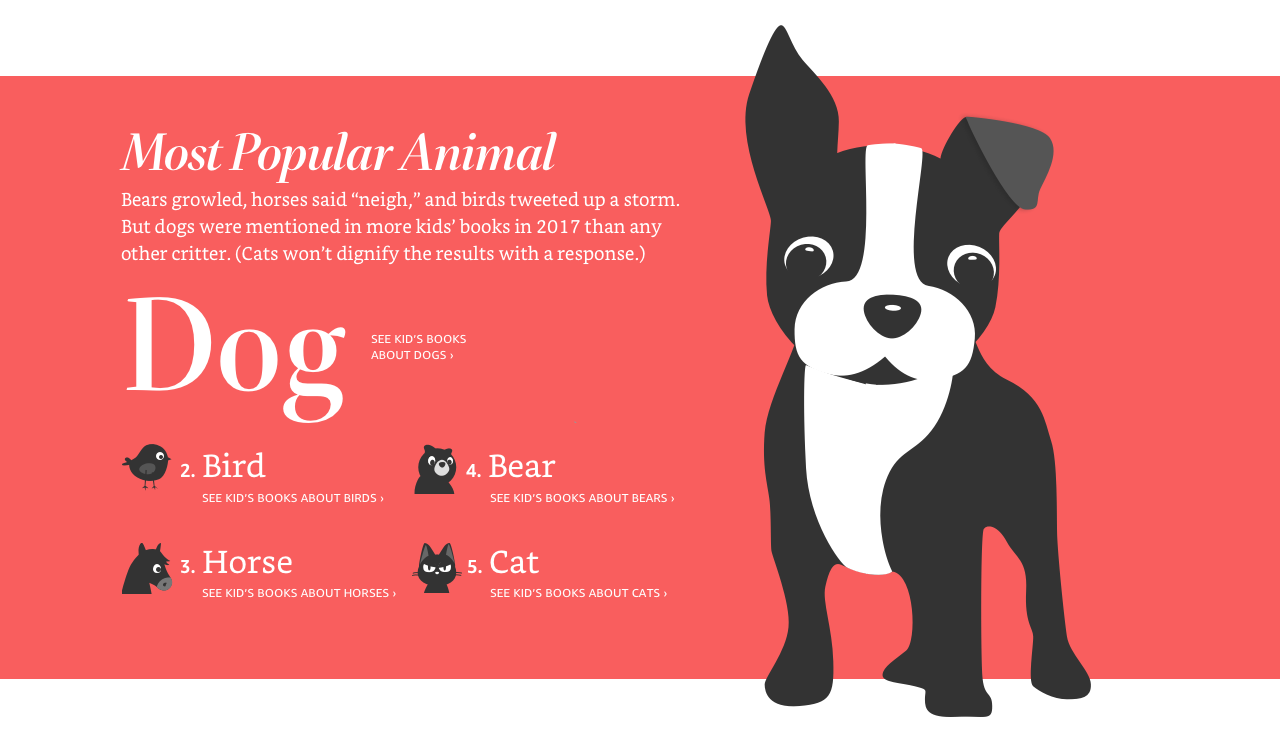
I dove deep into each "mini-story" and explored what data visualization would best serve the story we were trying to tell.
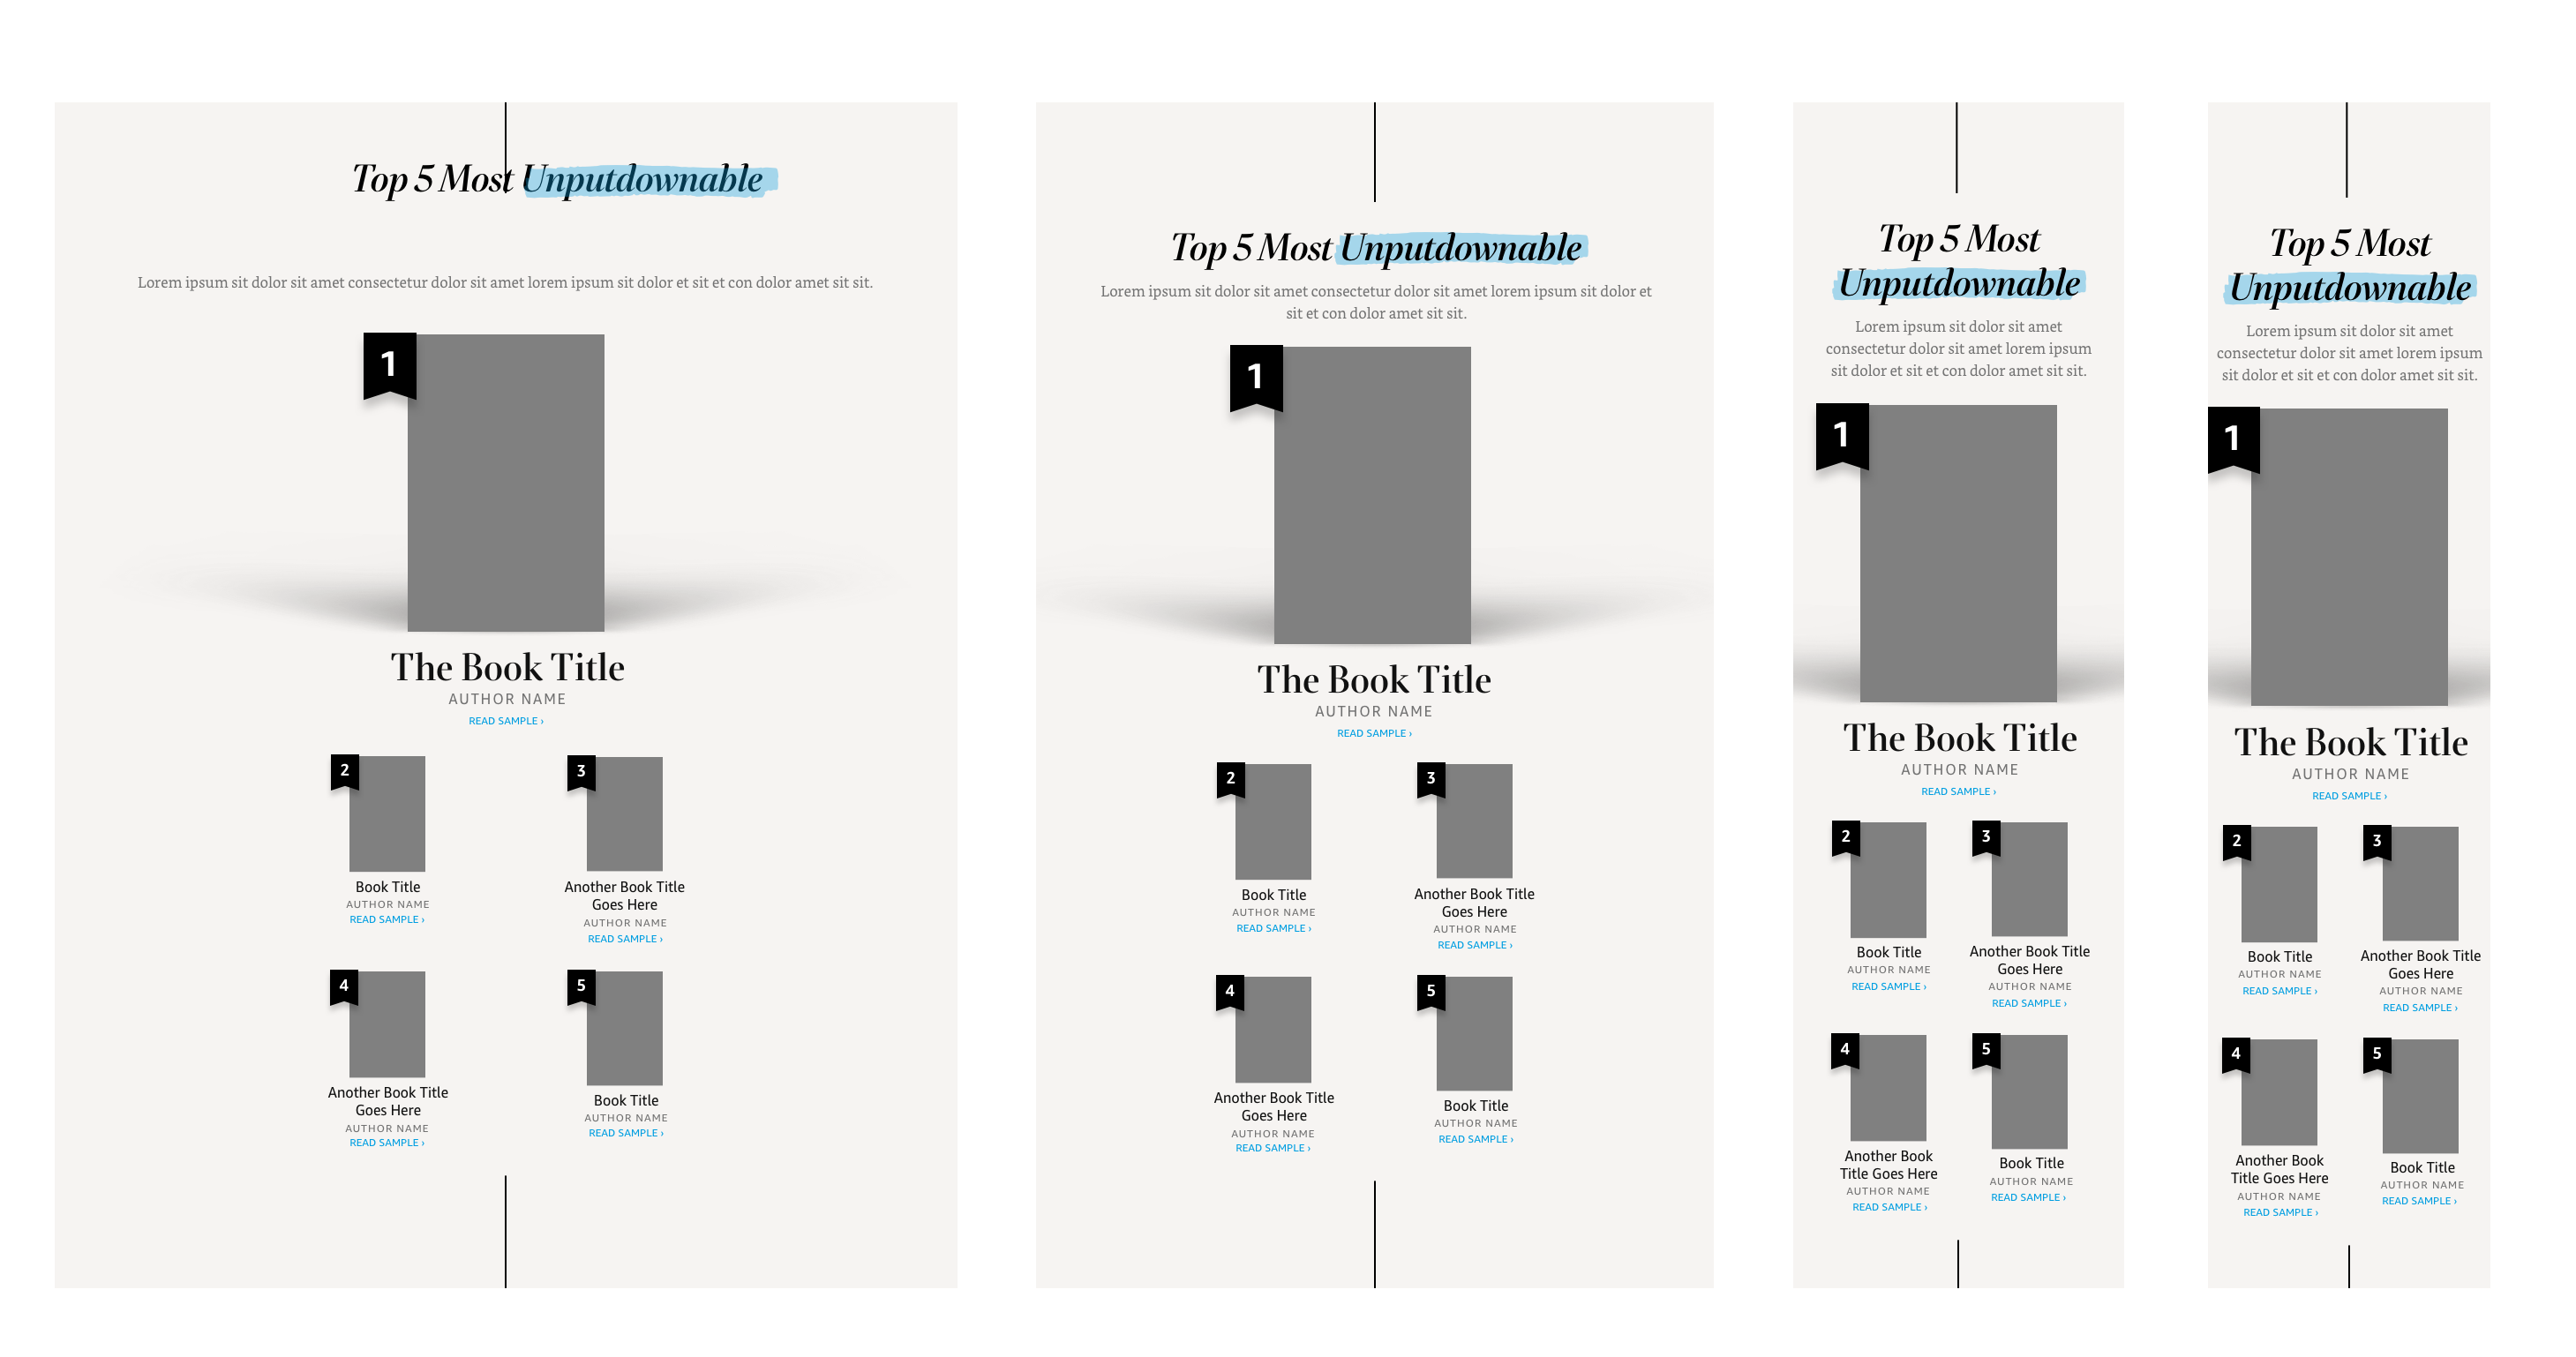
Responsive framework
We had to ensure that the page looked good no matter what screen size customers used.
Key insights
Focus on mobile first
Roughly 68% of customers viewed the page on a mobile device, while only 31.24% of customers viewed the experience on desktop devices. A much smaller percentage viewed the page at an ideal viewport of 1440px or higher.
Replicate the investment in high-quality design and cross-collaboration between design and editorial.
Customer feedback and internal feedback was overwhelmingly positive, with many designers claiming that we raised the bar for design within Amazon.
The result
The business impact
126,652
New subscribers to Amazon Charts
1 million
Page views
3.35%
Conversion rate
“Ever read a ‘year in review’ of books that delighted you? Seriously, this was beautifully done.”
– Customer feedback
“This page is flat out Amazing. Many good books already added to my Wishlist. Love the design and the data. Kudos to the team!”
– Sr. UX Designer, Amazon Last Mile
“Absolutely Fabulous!! I have just spent the last 20 minutes engaging with this experience, added numerous titles to my reading list (my family won’t see me for at least a month!)”
– Principle UX Designer, Amazon Video
“This is such good work! Wow, this gives the rest of us a lot of energy (& good hope) to ship something aesthetic and visceral.”
– UX Designer, Kindle Content
AMAZON PUBLISHING
Growing subscriptions by turning data into stories
Overview
Amazon Publishing asked for a year-end promo site showcasing top books by category–to boost amazon Charts awareness and subscriptions and lift Kindle holiday sales. I led the creative direction and produced illustrations to bring the concept to life.
Role
Creative direction, illustrator
responsibilities
UX and visual design
collaborators
Editorial directors, UX team, engineers
impact
126,652 new subscribers to Amazon Charts; 1 million page views; 3.36% conversion rate
The project
Customer problems
As a customer, I want to know what books were popular this year so that I’m in-the know and can find my next read.
Business problem
As a business, I want to grow awareness and subscriptions for Amazon Charts (a NYT Bestsellers competitor) and drive Kindle sales during the holiday season.
Success metrics
Increase subscriptions for Amazon Charts newsletter to 100,000.
Approach
Define the experience
Browse, discover, wonder: Let me browse the experience at my own speed, and choose which parts to dig into
Simple: Whether on my laptop or phone, I love to scroll fun, visual, editorial content. When I do engage, let me get the goods in one hover or click.
Share-ability: I share because it shows off my book prowess, because a fact was out-of-this-world interesting, or because it's one of the coolest things our industry has put out.
Novel, fresh facts: I find the content compelling because the facts and data tell a story that I hadn't heard before.

Gather inspiration
We gathered inspiration from other sites that told stories with data. We also took an audit from other projects at Amazon to ensure that this site fit into our ecosystem.
Define the high-level structure
Looking at the data we had, I sketched the high-level structure of page.
Visualizing the Data
I dove deep into each "mini-story" and explored what data visualization would best serve the story we were trying to tell.
Responsive framework
We had to ensure that the page looked good no matter what screen size customers used.
Key insights
Focus on mobile first
Roughly 68% of customers viewed the page on a mobile device, while only 31.24% of customers viewed the experience on desktop devices. A much smaller percentage viewed the page at an ideal viewport of 1440px or higher.
Replicate the investment in high-quality design and cross-collaboration between design and editorial.
Customer feedback and internal feedback was overwhelmingly positive, with many designers claiming that we raised the bar for design within Amazon.
The solution
The business impact
1 million
Page views
126,652
New subscribers to Amazon Charts
3.35%
Conversion rate
“Ever read a ‘year in review’ of books that delighted you? Seriously, this was beautifully done.”
– Customer feedback
“This page is flat out Amazing. Many good books already added to my Wishlist. Love the design and the data. Kudos to the team!”
– Sr. UX Designer, Amazon Last Mile
“Absolutely Fabulous!! I have just spent the last 20 minutes engaging with this experience, added numerous titles to my reading list (my family won’t see me for at least a month!)”
– Principle UX Designer, Amazon Video
“This is such good work! Wow, this gives the rest of us a lot of energy (& good hope) to ship something aesthetic and visceral.”
– UX Designer, Kindle Content
AMAZON PUBLISHING
Growing subscriptions by turning data into stories
Overview
Amazon Publishing asked for a year-end promo site showcasing top books by category–to boost amazon Charts awareness and subscriptions and lift Kindle holiday sales. I led the creative direction and produced illustrations to bring the concept to life.
Role
Creative direction, illustrator
responsibilities
UX and visual design
collaborators
Editorial directors, UX team, engineers
impact
126,652 new subscribers to Amazon Charts; 1 million page views; 3.36% conversion rate
The project
Customer problems
As a customer, I want to know what books were popular this year so that I’m in-the know and can find my next read.
Business problem
As a business, I want to grow awareness and subscriptions for Amazon Charts (a NYT Bestsellers competitor) and drive Kindle sales during the holiday season.
Success metrics
Increase subscriptions for Amazon Charts newsletter to 100,000.
Approach
Define the experience
Browse, discover, wonder: Let me browse the experience at my own speed, and choose which parts to dig into
Simple: Whether on my laptop or phone, I love to scroll fun, visual, editorial content. When I do engage, let me get the goods in one hover or click.
Share-ability: I share because it shows off my book prowess, because a fact was out-of-this-world interesting, or because it's one of the coolest things our industry has put out.
Novel, fresh facts: I find the content compelling because the facts and data tell a story that I hadn't heard before.

Gather inspiration
We gathered inspiration from other sites that told stories with data. We also took an audit from other projects at Amazon to ensure that this site fit into our ecosystem.
Define the high-level structure
Looking at the data we had, I sketched the high-level structure of page.
Visualizing the Data
I dove deep into each "mini-story" and explored what data visualization would best serve the story we were trying to tell.
Responsive framework
We had to ensure that the page looked good no matter what screen size customers used.
Key insights
Replicate the investment in high-quality design and cross-collaboration between design and editorial.
Customer feedback and internal feedback was overwhelmingly positive, with many designers claiming that we raised the bar for design within Amazon.
Focus on mobile first
Roughly 68% of customers viewed the page on a mobile device, while only 31.24% of customers viewed the experience on desktop devices. A much smaller percentage viewed the page at an ideal viewport of 1440px or higher.
The result
The business impact
126,652
New subscribers to Amazon Charts
1 million
Page views
3.35%
Conversion rate
“Ever read a ‘year in review’ of books that delighted you? Seriously, this was beautifully done.”
– Customer feedback
“This page is flat out Amazing. Many good books already added to my Wishlist. Love the design and the data. Kudos to the team!”
– Sr. UX Designer, Amazon Last Mile
“Absolutely Fabulous!! I have just spent the last 20 minutes engaging with this experience, added numerous titles to my reading list (my family won’t see me for at least a month!)”
– Principle UX Designer, Amazon Video
“This is such good work! Wow, this gives the rest of us a lot of energy (& good hope) to ship something aesthetic and visceral.”
– UX Designer, Kindle Content